
In our digital economy, data is the lifeblood of success. Every minute, colossal amounts of data are gathered and analyzed.
Inventory metrics KPIs are the secret sauce of business intelligence, enabling you to surpass goals and increase value.
Setting up and tracking inventory KPIs to evaluate and improve performance is crucial to thriving in this landscape.
But it's not just about collecting data—it's about effectively processing, analyzing, and visualizing insights.
In this article, we'll help you choose the right inventory metrics and provide essential best practices for inventory KPIs.
Let's begin!
Inventory metrics are key performance indicators (KPIs) that assess the efficiency and effectiveness of inventory management within a business.
Monitoring these metrics allows you to make data-driven decisions to optimize inventory levels, reduce costs, and improve overall operational performance.
Still, inventory metrics are not exhaustive and can vary depending on the nature of the business and industry.

If you want to avoid being overwhelmed by the abundance of inventory KPIs, focus on the metrics that directly impact your business's strategic objectives.
Inventory sales KPIs provide valuable context to gross sales data, offering a more comprehensive and nuanced measurement of sales performance.
These KPIs not only shed light on sales performance but also provide a more comprehensive understanding of overall performance and opportunities for improvement.
The stock-to-sales ratio assesses the health of your inventory levels by comparing the amount of inventory available for sale to the quantity already sold.

Ideally, retail brands aim for a ratio of around 4. It indicates a balance where you have enough inventory to prevent stockouts but not excessive amounts that lead to high holding costs.

The inventory turnover rate measures the speed at which inventory converts into sales within the warehouse.

Setting key performance indicators (KPIs) for the inventory turnover rate is essential for business owners and warehouse managers, considering the business's typical turnover and aspirations for future growth.

A high turnover rate indicates robust sales performance.
On the other hand, if turnover is slow, the KPIs will lag behind, highlighting the need to improve inventory management and sales efforts.
In general, it is desirable to have an inventory turnover rate between 2 and 4.
A rate below two suggests an excess of deadstock, while a rate above four indicates a potential risk of stockouts.

Suppose a company aims to determine its inventory days on hand for the previous year, knowing its inventory turnover ratio was 4.2.
To calculate it, the company would use the following formula:
Inventory Days on Hand: 365 / 4.2 = 86.904
Based on this calculation, the company held approximately 86.904 days' inventory during the past year.
💡 However, suppose your inventory turnover rate consistently improves and becomes excessively high. In that case, it may indicate that you are not pricing your products appropriately.
For example, you may undervalue your goods, potentially missing higher profit margins.
The cost of goods sold (COGS) represents the expenses of producing the goods the business sells.
This crucial inventory metric lets you comprehend your costs and calculate the gross profit margin.

It provides practical insights into the business's cost structure, helping to drive strategic pricing decisions and effective inventory management practices.

The stock-to-sales ratio indicates how often you have turned over your inventory within a specific period compared to a previous one.

With real-time monitoring, you can instantly track your inventory's movement. It allows you to make quick adjustments that improve efficiency in your supply chain and sales processes.

Days on Hand (DOH), Average Days to Sell Inventory (DSI), or Average Age of Inventory, measures the rate at which inventory is turned over on a daily basis.
Following an annual range, you should evaluate this metric within a daily timeframe.

Weeks on Hand assesses the average duration it takes for inventory to be sold within a week.
A high weeks-on-hand value indicates inefficient inventory movement, whereas a low weeks-on-hand value signifies efficient inventory turnover.

Consider a situation where a company possesses inventory valued at $43,780 and its cost of goods sold (COGS) for 2022 amounts to $373,400.
To compute the inventory days on hand, the company would employ the following formula:
Inventory Days on Hand: (43,780 / 373,400) x 365 = 42.795 days
Based on this calculation, the company had approximately 42.795 days' worth of inventory on hand in 2022.
The sell-through rate represents the percentage of inventory sold to customers.
Typically calculated monthly, you can assess your stocking and selling strategies and make necessary adjustments.

This metric can give you insights into sales fluctuations, trends, and shifts in customer demand.

The backorder rate represents the percentage of customer orders you can't fulfill due to stockouts, supply chain issues, or inventory glitches.

It reveals the efficiency of the entire supply chain and the extent to which you meet customer demand.
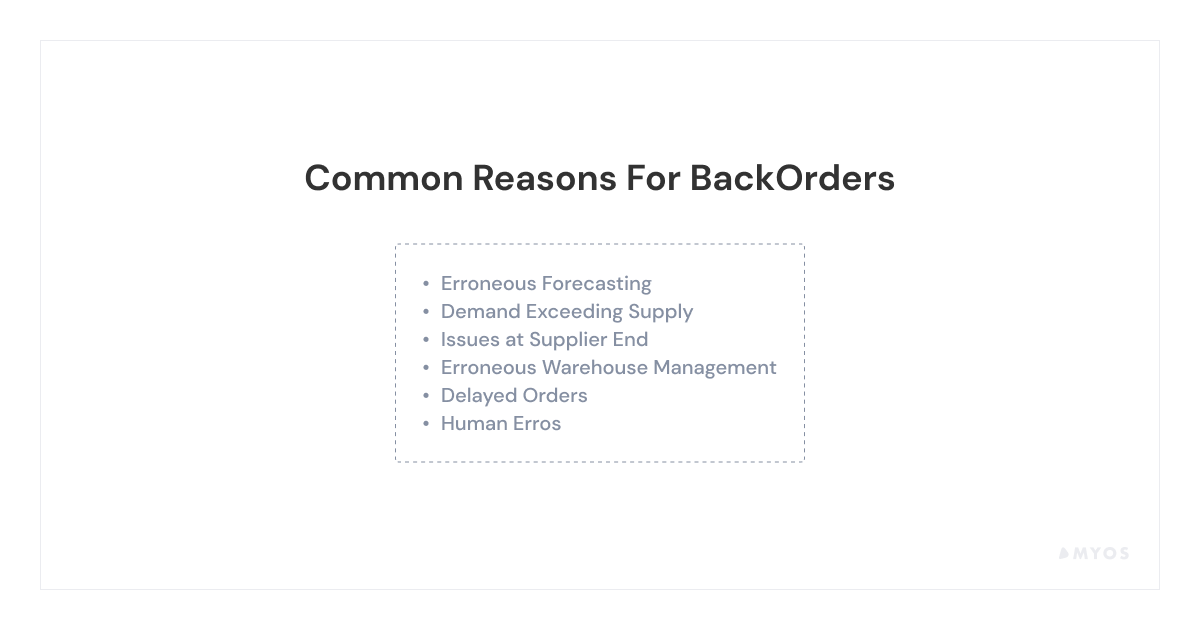
When the backorder rate is high, it indicates that customers have to endure waiting times as their orders are being fulfilled.
This situation can have negative implications for customer satisfaction and long-term customer retention.
It is crucial to monitor this KPI as it helps identify the reasons behind the unavailability of certain items and enables proactive measures to address trends that may impact performance, such as seasonal demand.
As a result, you can take necessary actions to minimize customer waiting times, enhance satisfaction, and improve overall operational efficiency.
Focusing on the following inventory metrics can reduce workplace downtime and fulfillment costs and improve customer satisfaction.
The inventory accuracy KPI evaluates the precision of your inventory management system by comparing the actual count of items in stock with the recorded quantities in your database.

With the data you get, you can do some prompt corrective actions, such as adjusting stock levels, investigating potential causes of inaccuracies, and implementing process improvements.
Inventory shrinkage refers to reduced inventory caused by various factors, including damage, spoilage, theft, and errors.

This formula quantifies the percentage of inventory losses concerning the total value of the inventory.
Afterward, you can implement strategies to minimize shrinkage, such as improving security measures, enhancing quality control processes, and implementing effective inventory management practices.

Receiving efficiency measures the effectiveness and productivity of the process involved in receiving goods or materials into your storage facility.
It is a significant KPI that you should use in supply chain management and warehouse management.
Various formulas evaluate the efficiency of this aspect of the supply chain.

Order cycle time assesses the duration of the entire order process, including receiving.

Dock door utilization efficiency is another valuable formula that provides insights into the efficiency of warehouse usage.

By measuring and analyzing these metrics, your productivity increases and operations become more efficient.

Tracking order fulfillment and warehousing metrics can help you identify bottlenecks and improve overall operational efficiency.
Order fill rate quantifies the percentage of customer orders fulfilled on time and as expected.

A higher order fill rate indicates a larger proportion of customer orders that have been successfully completed, reflecting higher customer satisfaction levels.
Let's say a customer orders 50 shirts, but you are only able to ship 20 shirts at the time of ordering. In this case, the fill rate can be calculated as follows:
Fill Rate: (Shirts Shipped / Shirts Ordered) * 100
= (20 / 50) * 100
= 40%
In this scenario, the fill rate indicates that only 40% of the ordered shirts were shipped at the time of ordering.
It's important to note that this example assumes a single order from a single customer.
As the number of customers and orders increases, calculating the fill rate becomes more complex.
Employing a specialized order management system that automates reporting can be highly advantageous to handle such situations efficiently.
Ideally, a fill rate percentage as close to 100% is desirable.
It indicates you can fulfill every purchase without worrying about stockouts or backorders.
However, achieving that is often challenging, as it would require having every requested product readily available in stock at all times.
On average, most companies aim for a fill rate of 85-95%, which means some products may occasionally be out of stock or demand may exceed expectations.
The order accuracy rate assesses the precision of orders shipped in quantity, quality, and specifications.

A higher order accuracy rate signifies superior product picking, packing, and shipping accuracy.
Thus, it reduces the occurrence of returns, replacements, and customer complaints.
It also helps maintain a positive brand image, foster customer loyalty, and increase the likelihood of repeat business.
The average inventory value effectively quantifies the capital invested during a specific period.
It shows the value of inventory held at a given point, which in turn contributes to financial analysis and informs business decision-making.

Too much value tied up in inventory can restrict cash flow for other essential purposes. At the same time, too little inventory poses the risk of stockouts and other operational challenges.
Accurate forecasting ensures seamless workflow and effective supply chain management. Forecasting has evolved significantly, incorporating advanced technologies like artificial intelligence (AI) to estimate future sales potential more precisely.
Sales velocity measures the speed at which sales progress through a company's systems. It encompasses the entire sales cycle of a product, including the time it takes to convert a sale, the value of the sale, and the potential number of sales.

Using this formula, you can determine how quickly you need to replenish your inventory or acquire new products and materials.
Suppose you had 5000 website visitors in May, with an average order value of INR 1,000 and a conversion rate of 1%.
Considering that May has 31 days, we can calculate the sales velocity as follows:
Sales Velocity = (Number of Visitors X Average Order Value X Conversion Rate) / Length of Time Period
Sales Velocity = (5000 X 1,000 X 0.01) / 31 = INR 1,612.90 per day
Based on this calculation, your sales velocity for May amounts to approximately INR 1,612.90 per day.
As a result, you’ll get the average daily revenue generated from your website visitors, considering the number of visitors and the conversion rate.
Monitoring sales velocity allows you to assess your sales efforts' effectiveness and track your online business's performance.
The optimal reorder point formula determines the ideal inventory level for initiating a new order.
This metric is crucial to preventing stockouts and ensuring you replenish inventory on time.
Additionally, it incorporates the concept of safety stock, which serves as a buffer to account for any unexpected variations in demand or delays in the supply chain.

The economic order quantity (EOQ) determines the optimal order quantity that minimizes total inventory costs.
EOQ aims to balance holding costs (costs associated with holding inventory) and ordering costs (costs associated with placing and receiving orders).

The objective is to find the order quantity that minimizes overall inventory costs while ensuring an efficient supply chain and meeting customer demand.

Monitoring inventory metrics can benefit your business in multiple ways.
You can identify areas for improvement, spot trends and patterns, and proactively address issues such as stockouts, excess inventory, or inaccurate records.
Furthermore, implementing inventory management best practices, leveraging technology solutions, and aligning inventory strategies with customer demand are essential for optimizing inventory metrics.
To take your business to new heights, partnering with Myos for inventory financing can be a game-changer.
Myos enables you to meet high product demand while nurturing strong customer relationships. With Myos, you gain access to the necessary resources to effectively manage inventory, ensuring that you can fulfill customer orders efficiently and maintain a competitive edge in the market.
With the additional working capital of up to £2,500,000, you can:
So, if you want to learn more about how Myos can help you boost your business, sign up and get a free, non-binding offer today!
21 Most Important Small Business Statistics in 2023
Cash Conversion Cycle Explained
Short-Term Business Loans vs Long-Term Business Loans - Which is Better?


.png)


.png)
